- Alaskan Yachts
- Azimut Yachts
- Back Cove Yachts
- Beneteau Yachts
- Benetti Superyachts
- Bertram Yachts
- Boston Whaler
- Broward Yachts
- Buddy Davis Sportfish
- Burger Yachts
- Cabo Yachts
- Catamarans
- Carver Motoryachts
- Center Console
- Chris-Craft Yachts
- Cruisers Yachts
- DeFever Trawlers
- Dufour Sailboats
- Fairline Yachts
- Feadship Yachts
- Ferretti Yachts
- Formula Yachts
- Fountaine Pajot Cats
- Grady-White
- Grand Banks Trawlers
- Hargrave Yachts
- Hatteras Yachts
- Hinckley Picnic Boats
- Horizon Yachts
- Hydra-Sports
- Intrepid Boats
- Jarrett Bay Sportfish
- Jeanneau Yachts
- Kadey-Krogen Trawlers
- Lazzara Yachts
- Lekker Boats
- Luhrs Sportfish
- Marlow Yachts
- Maritimo Yachts
- Marquis Yachts
- McKinna Motoryachts
- Meridian Yachts
- Midnight Express
- MJM Yachts
- Mochi Craft
- Neptunus Motoryachts
- Nordhavn Trawlers
- Nordic Tugs
- Numarine Yachts
- Ocean Alexander Yachts
- Offshore Yachts
- Outer Reef
- Oyster Sailing Yachts
- Pacific Mariner Yachts
- Palmer Johnson Yachts
Business Jet Sales and Boat Sales Trend Report
June 6, 2016 11:51 am
Today we continue our series where we’re analyzing trends in boat sales compared to other industries. In this post, we will share an analysis of the data comparing business jet sales and boat sales.
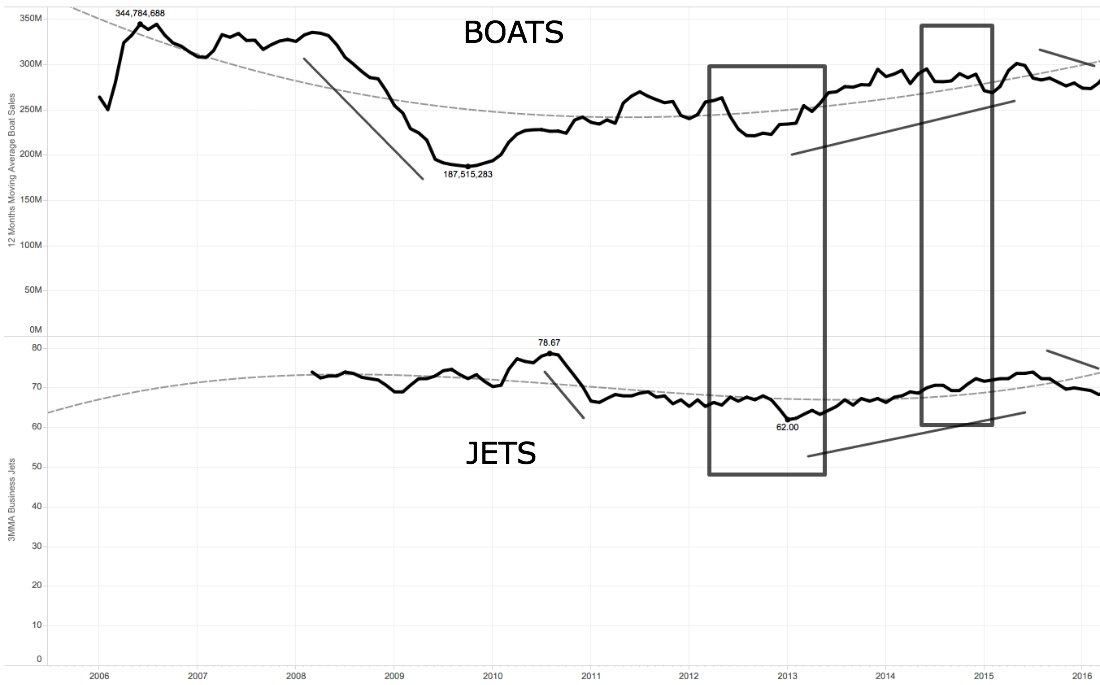
We used data on new business jets registrations from the Federal Aviation Administration, using a 3-month moving average since 2008:

Although the two graphs have visible correlations, especially from 2013-2016, the high/low points of the twp graphs do not match. Because it is a less volatile market, business jets’ reaction to economic cycles lags compared to the boat market.
Meanwhile, similar to the S&P 500 Index and the New Homes Sales, the trend lines of the two graphs go in the same direction, suggesting that there are similarities in customers’ behavior in both markets.


