- Alaskan Yachts
- Azimut Yachts
- Back Cove Yachts
- Beneteau Yachts
- Benetti Superyachts
- Bertram Yachts
- Boston Whaler
- Broward Yachts
- Buddy Davis Sportfish
- Burger Yachts
- Cabo Yachts
- Catamarans
- Carver Motoryachts
- Center Console
- Chris-Craft Yachts
- Cruisers Yachts
- DeFever Trawlers
- Dufour Sailboats
- Fairline Yachts
- Feadship Yachts
- Ferretti Yachts
- Formula Yachts
- Fountaine Pajot Cats
- Grady-White
- Grand Banks Trawlers
- Hargrave Yachts
- Hatteras Yachts
- Hinckley Picnic Boats
- Horizon Yachts
- Hydra-Sports
- Intrepid Boats
- Jarrett Bay Sportfish
- Jeanneau Yachts
- Kadey-Krogen Trawlers
- Lazzara Yachts
- Lekker Boats
- Luhrs Sportfish
- Marlow Yachts
- Maritimo Yachts
- Marquis Yachts
- Mazu Yachts
- McKinna Motoryachts
- Meridian Yachts
- Midnight Express
- MJM Yachts
- Mochi Craft
- Neptunus Motoryachts
- Nordhavn Trawlers
- Nordic Tugs
- Numarine Yachts
- Ocean Alexander Yachts
- Ocean King
- Offshore Yachts
- Outer Reef
- Oyster Sailing Yachts
- Pacific Mariner Yachts
- Palmer Johnson Yachts
June 13, 2016 12:23 pm
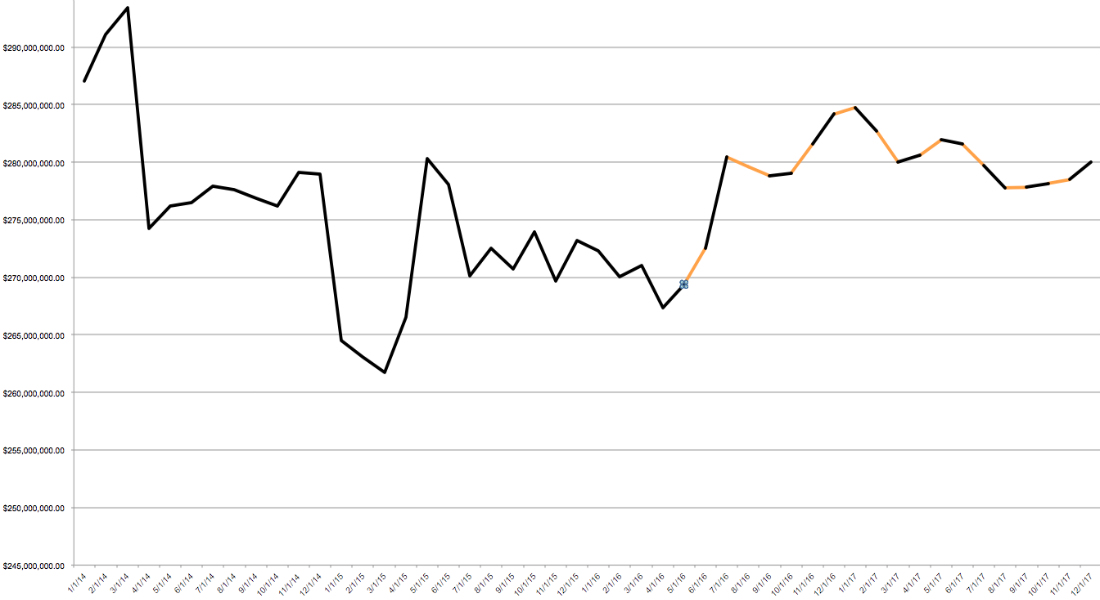
In the previous posts in our data analysis series, we’ve analyzed the correlations between boat sales and other indicators, such as the S&P 500 Index, new home sales, business jet sales, and U.S. corporate profits. Today we’ll share the boat sales forecast for 2016-2017 that we computed using multiple linear regression, which uses historical data to predict trends.
The prediction of the boat sales (the dependent variable) is derived from 3 forecasts (independent variables): new homes sales, the S&P 500 Index, and the MSCI Index, which measures the performance of a global economy. These provide the best correlation with boat sales historically.
Here are current and forecast boat sales:

The results of a statistical analysis reveal that more than 60% of predicted boat sales data points can be explained by just three variables, which is a good result.
Certainly, there are many more factors that influence boat sales, but since these three indicators typically are good indicators of the economy, they can be used as a solid baseline for a boat sales forecast.


